views
X
Research source
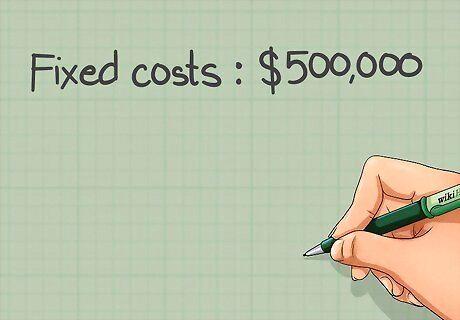
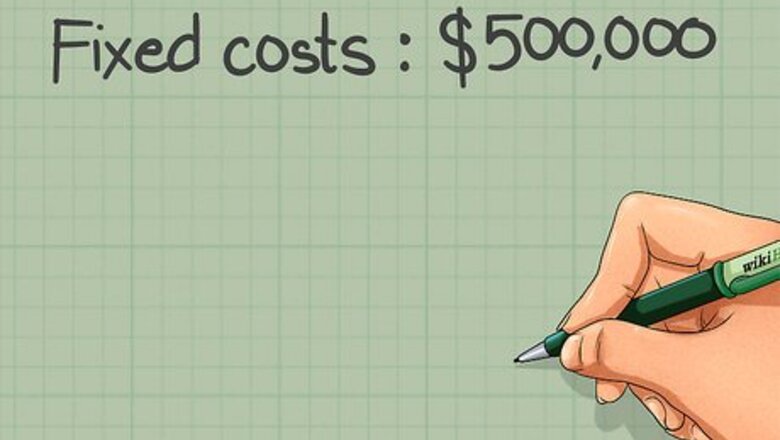
Determine your company's fixed costs. Fixed costs are any costs that don't depend on the volume of production. Rent and utilities would be examples of fixed costs, because you will pay the same amount for them no matter how many units you produce or sell. Categorize all your firm's fixed costs for a given period and add them together.
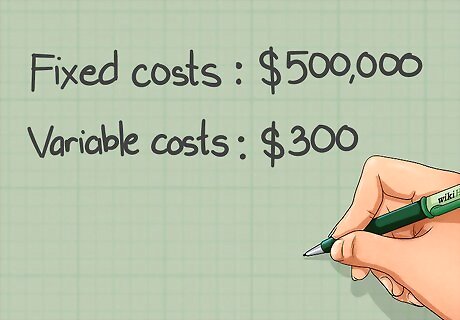
Determine your company's variable costs. Variable costs are those that will fluctuate along with production volume. For example, a business that sells shirts will have to purchase more shirts if they want to sell more shirts, so the cost of buying shirts is a variable cost.
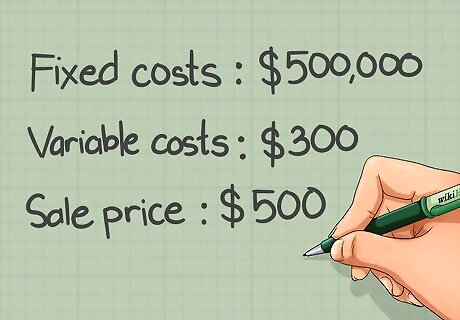
Determine the price at which you will sell your product. Pricing strategies are part of the much more comprehensive marketing strategy, and can be fairly complex. However, you know that your price will be at least as high as your production costs.
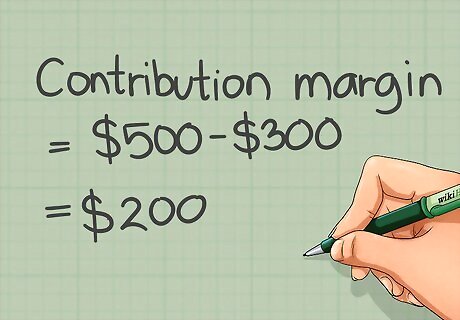
Calculate your unit contribution margin. The unit contribution margin represents how much money each unit sold brings in after recovering its own variable costs. It is calculated by subtracting a unit's variable costs from its sales price. Contribution Margin= (Selling price / unit - Variable cost / unit)
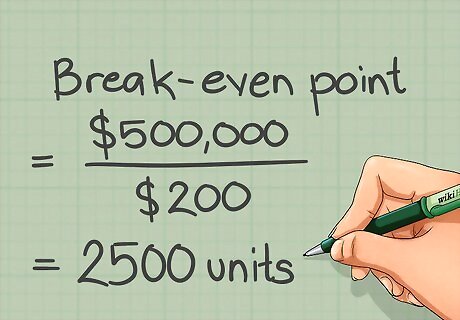
Calculate your company's break-even point. The break-even point tells you the volume of sales you will have to achieve to cover all of your costs. It is calculated by dividing all your fixed costs by your product's contribution margin. Break Even Point= Total Fixed Cost / Contribution Margin
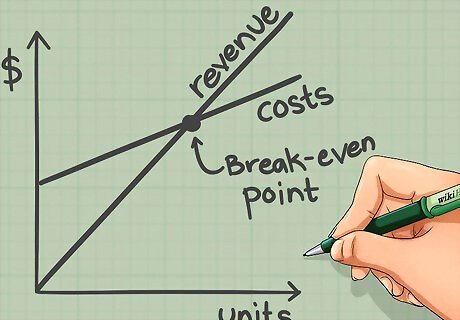
Plot it on a graph. X-axis is 'number of units' and Y-axis is 'revenue'. The plot of Fixed cost will be a line parallel to X axis and above the X axis. The line of Total cost would start from the point where line of fixed cost meets the Y axis. It would have a positive slope. The line of sales revenues would start from origin (0,0) and move upward with a slope greater than that of the total cost line. The point where these two lines intersect will be the 'Break Even Point'.


Comments
0 comment