views
X
Research source
That is, there must be some form of a fraction, involving more than just the coefficients. Thus,
y
=
1
/
2
x
+
2
{\displaystyle y=1/2x+2}
is not a rational function, because the only fraction is a coefficient term. However,
y
=
3
x
−
1
x
2
+
2
x
+
1
{\displaystyle y={\frac {3x-1}{x^{2}+2x+1}}}
is a rational function. A vertical asymptote is a representation of values that are not solutions to the equation, but they help in defining the graph of solutions.[2]
X
Research source
Finding Vertical Asymptotes
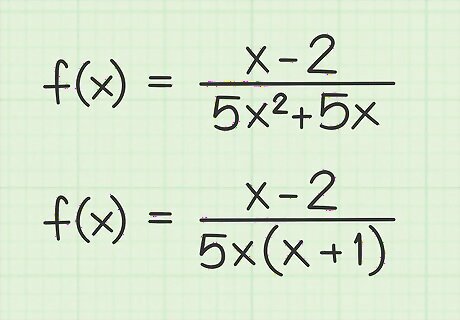
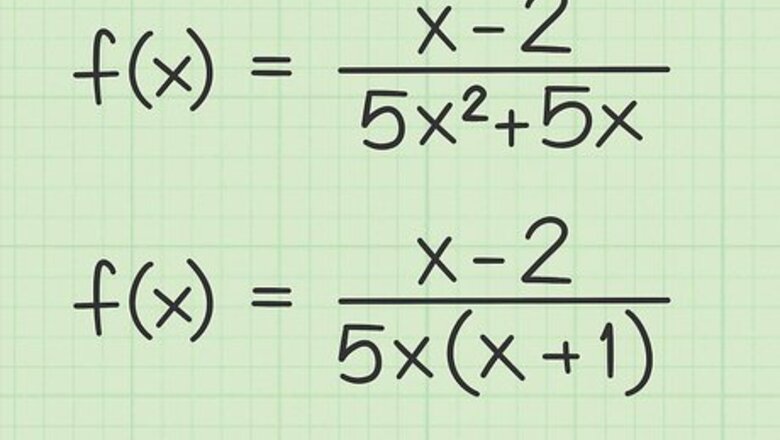
Factor the denominator of the function. To simplify the function, you need to break the denominator into its factors as much as possible. For the purpose of finding asymptotes, you can mostly ignore the numerator. For example, suppose you begin with the function x − 2 5 x 2 + 5 x {\displaystyle {\frac {x-2}{5x^{2}+5x}}} {\frac {x-2}{5x^{2}+5x}}. The denominator 5 x 2 + 5 x {\displaystyle 5x^{2}+5x} 5x^{2}+5x can be factored into the two terms ( 5 x ) ( x + 1 ) {\displaystyle (5x)(x+1)} (5x)(x+1). As another example, consider the function y = 3 x + 1 x 2 + 2 x + 1 {\displaystyle y={\frac {3x+1}{x^{2}+2x+1}}} y={\frac {3x+1}{x^{2}+2x+1}}. You should recognize the denominator as a simple quadratic function, which can be factored into ( x + 1 ) ( x + 1 ) {\displaystyle (x+1)(x+1)} (x+1)(x+1). Recognize that some denominator functions may not be able to be factored. For example, in the equation y = x 2 − 2 x 2 + 3 x − 1 {\displaystyle y={\frac {x^{2}-2}{x^{2}+3x-1}}} y={\frac {x^{2}-2}{x^{2}+3x-1}}, the function in the denominator, x 2 + 3 x − 1 {\displaystyle x^{2}+3x-1} x^{2}+3x-1 cannot be factored. For this first step, you will just have to leave it in that form. If you need to review factoring of functions, check out the articles Factor Algebraic Equations or Factor Second Degree Polynomials (Quadratic Equations).
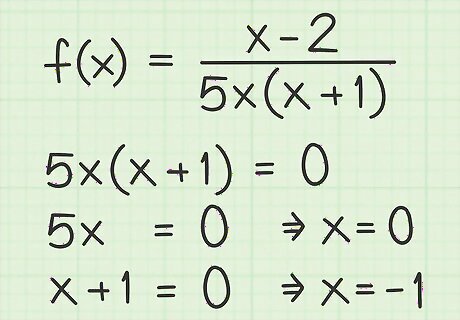
Find values for which the denominator equals 0. Still disregarding the numerator of the function, set the factored denominator equal to 0 and solve for x. Remember that factors are terms that multiply, and to get a final value of 0, setting any one factor equal to 0 will solve the problem. Depending on the number of factors that exist, you may find one or more solutions. For example, if a denominator function factored as ( 5 x ) ( x + 1 ) {\displaystyle (5x)(x+1)} (5x)(x+1), then you would set this equal to 0 as ( 5 x ) ( x + 1 ) = 0 {\displaystyle (5x)(x+1)=0} (5x)(x+1)=0. The solutions will be any values of x that make this true. To find those values, set each individual factor equal to 0, to create two mini-problems of 5 x = 0 {\displaystyle 5x=0} 5x=0 and x + 1 = 0 {\displaystyle x+1=0} x+1=0. The first solution is x = 0 {\displaystyle x=0} x=0 and the second is x = − 1 {\displaystyle x=-1} x=-1. Given another example with a denominator of x 2 + 5 x + 6 {\displaystyle x^{2}+5x+6} x^{2}+5x+6, this could be factored into the two terms ( x + 3 ) ( x + 2 ) {\displaystyle (x+3)(x+2)} (x+3)(x+2). Setting each factor equal to 0 leads to x + 3 = 0 {\displaystyle x+3=0} x+3=0 and x + 2 = 0 {\displaystyle x+2=0} x+2=0. Therefore, the solutions for this problem would be x = − 3 {\displaystyle x=-3} x=-3 and x = − 2 {\displaystyle x=-2} x=-2.
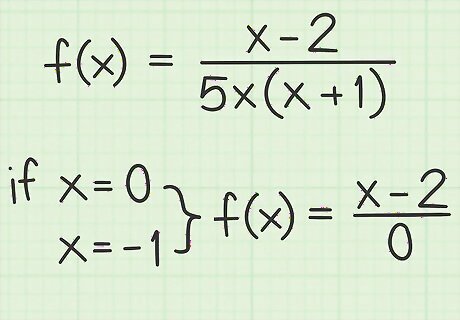
Understand the meaning of the solutions. The work you have done to this point identifies values of x for which the denominator of the function equals 0. Recognize that a rational function is really a large division problem, with the value of the numerator divided by the value of the denominator. Because dividing by 0 is undefined, any value for x for which the denominator will equal 0 represents a vertical asymptote for the full function.
Graphing Vertical Asymptotes
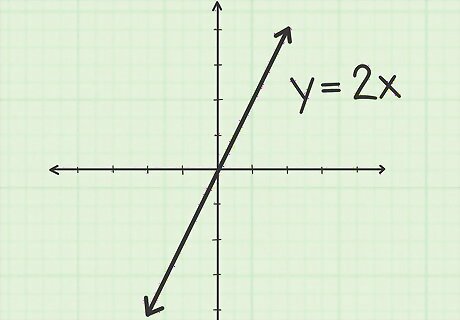
Review the meaning of a graph. A graph of a function is a visual representation of the values of x and y that are solutions to a given equation. The graph may consist of individual points, a straight line, a curved line, or even some closed figures like a circle or an ellipse. Any point that lies on the line could be a solution to the equation. For example, a simple equation like y = 2 x {\displaystyle y=2x} y=2x will have infinite solutions. Written in pairs of (x,y), some possible solutions are (1,2), (2,4), (3,6), or any pair of numbers in which the second number is double the first. Plotting these points on the x,y coordinate plane will show a continuous straight line that appears as a diagonal that goes upward from left to right. To see more samples of this type of graph, you may want to review Graph Linear Equations. A graph of a quadratic equation is one that has an exponent of 2, such as y = x 2 + 2 x − 1 {\displaystyle y=x^{2}+2x-1} y=x^{2}+2x-1. Some sample solutions are (-1,-2), (0,-1), (1,1), (2,7). If you plot these points, and others, you will find the graph of a parabola, which is a u-shaped curve. To review this type of graph, you can look at Graph a Quadratic Equation. If you need more help reviewing how to graph functions, read Graph a Function or Graph a Rational Function.
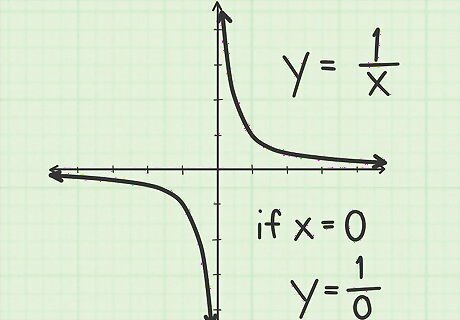
Recognize asymptotes. An asymptote is a straight line that generally serves as a kind of boundary for the graph of a function. An asymptote can be vertical, horizontal, or on any angle. The asymptote represents values that are not solutions to the equation, but could be a limit of solutions. For example, consider the equation y = 1 x {\displaystyle y={\frac {1}{x}}} y={\frac {1}{x}}. If you begin at the value x=3 and count down to select some solutions for this equation, you will get solutions of (3, 1/3), (2, 1/2), and (1,1). If you continue counting down, the next value for x would be 0, but this would create the fraction y=1/0. Because division by 0 is undefined, this cannot be a solution to the function. Therefore, the value of x=0 is a vertical asymptote for this equation.
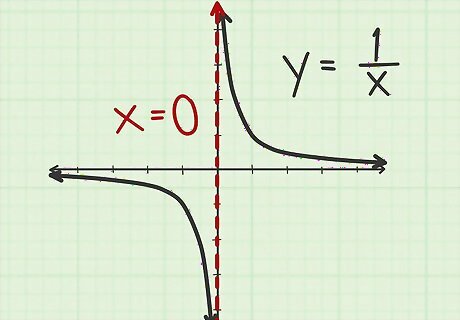
Graph vertical asymptotes with a dotted line. Conventionally, when you are plotting the solution to a function, if the function has a vertical asymptote, you will graph it by drawing a dotted line at that value. In the example of y = 1 x {\displaystyle y={\frac {1}{x}}} y={\frac {1}{x}}, this would be a vertical dotted line at x=0.


Comments
0 comment